Designing a Compliant Legionella Monitoring System
If you’re responsible for a building or an estate, you already know that Legionella compliance isn’t about ticking boxes. It’s about being able to stand behind your decisions when systems change, buildings evolve, and questions are asked.
This walkthrough is designed to help you move from habit to intent, starting with your schematic drawing and ending with a clear financial reality check.
Certified member of the Legionella Control Association (LCA) and trusted nationwide by high-stakes sectors like Healthcare and Housing.


Everything starts with the schematic
Before you think about visits, sensors, data, or cost, there is one non-negotiable requirement:
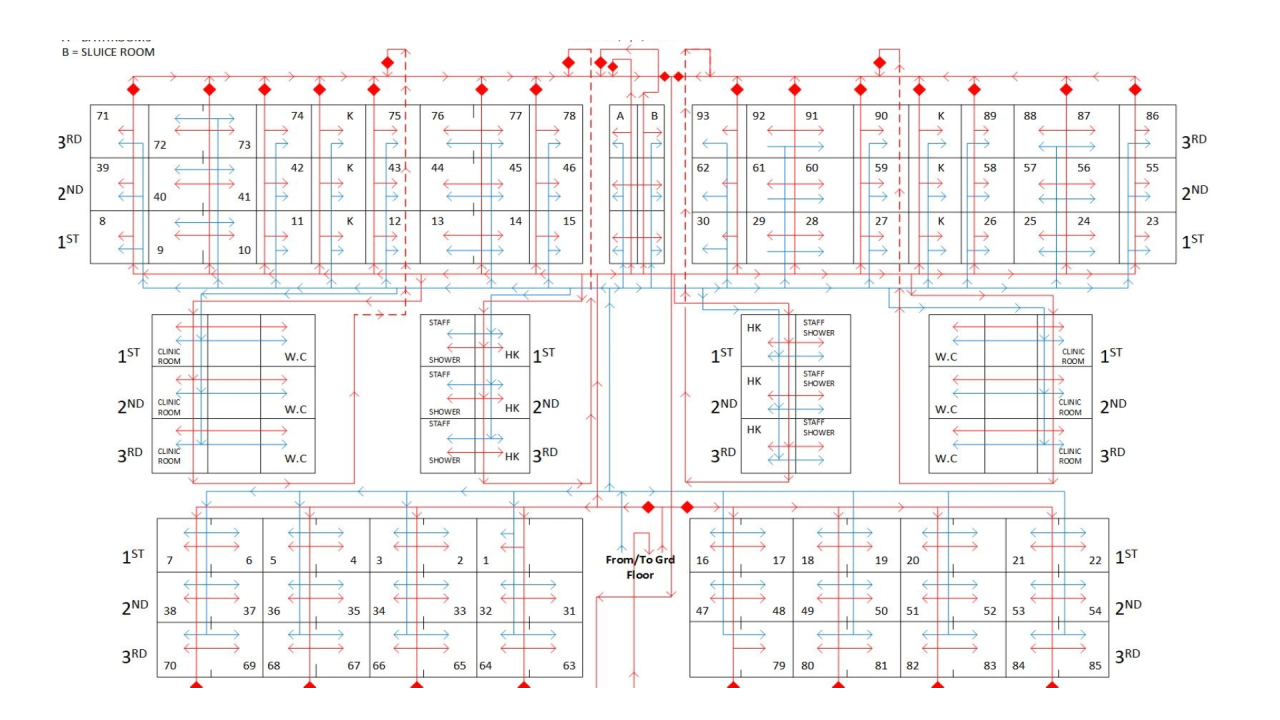
You need an accurate schematic drawing of your water system.
If your schematic is wrong, everything built on top of it is compromised. Monitoring points are guessed rather than justified. Data; whether manual or automated becomes misleading. And when something goes wrong, explaining why decisions were made becomes extremely difficult.
This is true whether you:
- continue with traditional manual temperature checks, or
- move toward automated monitoring
An accurate schematic is what connects the physical system, the risk assessment, and the monitoring regime into something defensible.
If your schematic isn’t right, you can prove activity, but not control.
If you need help correcting or producing a compliant schematic, we provide this as a standalone service.
Where legislation expects you to demonstrate control
UK guidance (ACoP L8 and HSG 274 Part 2) doesn’t expect you to “check a few outlets and hope for the best”.
It sets clear expectations about where control must be demonstrated.
Using the schematic example in Appendix 4 of HSG 274 Part 2, this walkthrough shows you how to identify monitoring requirements across your system — including:
incoming cold water supplies
calorifiers and hot water generation
hot water
return loops
sentinel
outlets
higher-risk and low-use areas
This stage isn’t about technology.
It’s about understanding how many points of visibility are actually required to demonstrate control of your system.
Once you see this mapped properly, compliance stops feeling vague.
Turning a schematic into a monitoring strategy
When your schematic is accurate and legislative expectations are clear, the next step becomes straightforward.
From that, the required number of monitoring points becomes clear — not estimated, not inherited, not based on convenience.
Designed.
You can see:
- where temperatures must be known
- where stagnation risk exists
- where loss of control would matter most
At this point, you should be able to answer questions like:
- Why is each monitoring point there?
- What part of the system does it protect?
- How does it relate back to the schematic and risk assessment?
That’s the difference between doing checks and managing risk.
What would this actually cost for your system?
Most organisations only discover the cost of improved monitoring after a sales conversation.
This walkthrough deliberately does the opposite.
Once you understand how many monitoring points your system genuinely requires, you can calculate cost before speaking to anyone.
The Legionella Watch System Cost Calculator allows you to see:
installation
costs
ongoing
monitoring costs
how those compare with your
current regime
There’s no sales range and no pressure to proceed. If the cost feels disproportionate, that’s useful information.
It tells you something important about your system and your current approach.


Does changing your approach actually make sense?
Cost alone doesn’t tell you whether improving monitoring is justified.
The final step in the journey is to compare:
- what you currently spend on manual monitoring
- what improved monitoring would cost
- what disruption, investigation, and response cost when issues arise
The ROI calculator allows you to see this clearly.
Here’s something we’re open about:
If this doesn’t show a saving, Legionella Watch probably isn’t right for you.
That usually means:
- the system is genuinely small, or
- existing budgets are already minimal
In those cases, the right answer is proportionate management — not forcing technology into the equation.
But if the numbers do stack up, you’re no longer guessing.
You’re making a decision based on
your system, your risk, and your data.
This isn’t about selling you a system
This walkthrough exists to help you decide — confidently — whether changing how you monitor makes sense for your buildings.
By the time you reach the end, you should know:
- whether your current monitoring regime is defensible
- where your blind spots are
- what “good” actually looks like for your system
- whether automated monitoring would genuinely improve control
If you decide to speak with us, the conversation starts from a position of clarity — not persuasion.
A moment to pause
As you’ve worked through this journey, you’ll already know which parts of your estate feel most fragile.
The buildings with complex systems.
The areas where occupancy changes constantly.
The sites where disruption would be hardest to explain.
The question isn’t whether change is possible.
It’s whether you’d rather discover loss of control early — or be forced into action when disruption makes it unavoidable.


Trusted by leading organisations across the UK.
What You Can Expect
Richard Thornett - Lead Engineer - BSW Southampton
“It is like having an engineer 24/7 with their hand on the plant”
James Shaw - Director - Miller Freeman - Nottingham
"The real time data allowed us to make several minor adjustments and changes to achieve satisfactory temperatures throughout the property that would not normally be picked up."
Brendon Moylan - Property Manager - Oakfield Community
“It gives us a good hold on monitoring the whole system”
Andy - Director - Tackle Tidy - Redditch
“I can sleep at night knowing that I'm not putting us in any kind of danger”
Compliance starts with understanding
Need something you can share internally with your team?
Download the one-page, board-ready briefing that explains how Legionella monitoring should be designed — from schematic through to cost and ROI.
Legionella compliance isn’t about inheriting routines.
It’s about understanding your system well enough to make defensible decisions over time.
Zero signup required. Get access to the PDF.
Talk it through before disruption forces the conversation
If you want to discuss what earlier visibility could look like across your sites and how it reduces disruption risk we’re happy to help.
Our team is ready to help whether you manage one site or many.
or call 01827 259346 to get started today.